Figure 1
Three year outcomes following positive cross match renal transplantation despite failure to convert to Negative Flow Cross Match after Desensitization
Shree Patel*, Jamie Benken, Patricia West Thielke, Sanjeev Akkina, Enrico Benedetti and James Thielke
Published: 30 August, 2018 | Volume 2 - Issue 2 | Pages: 029-038

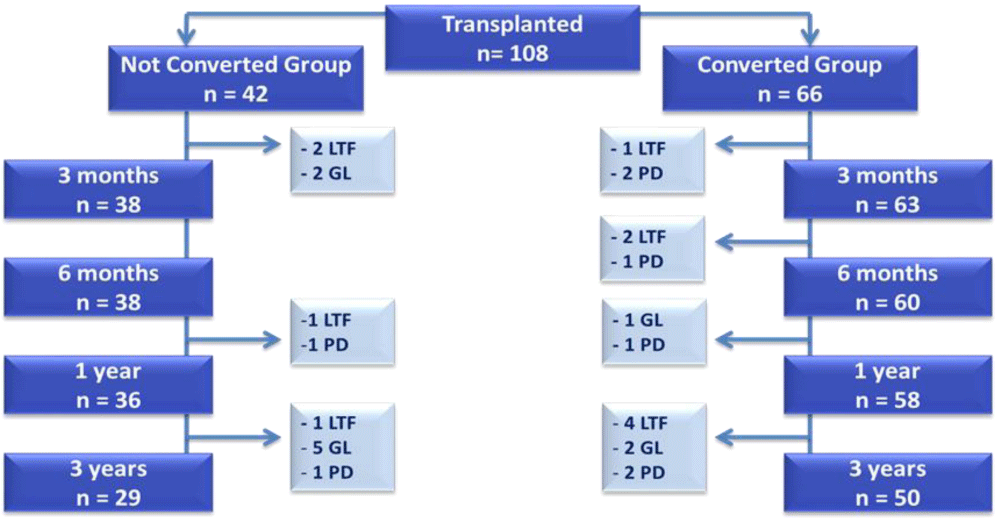
Figure 1:
Disposition of Patients- CONSORT Diagram. Depicts the disposition of patients, number of patients available for analysis at each time point, and cause for the diminishing patient population over time. GL= Graft Loss; LTF= Lost to Follow-Up; PD= Patient Death.
Read Full Article HTML DOI: 10.29328/journal.jcn.1001016 Cite this Article Read Full Article PDF
More Images
Similar Articles
-
Three year outcomes following positive cross match renal transplantation despite failure to convert to Negative Flow Cross Match after DesensitizationShree Patel*,Jamie Benken,Patricia West Thielke,Sanjeev Akkina,Enrico Benedetti,James Thielke. Three year outcomes following positive cross match renal transplantation despite failure to convert to Negative Flow Cross Match after Desensitization . . 2018 doi: 10.29328/journal.jcn.1001016; 2: 029-038
-
Urine Leak Following Kidney Transplantation: An Evidence-based Management PlanShafiq A Chughtai,Ajay Sharma,Ahmed Halawa*. Urine Leak Following Kidney Transplantation: An Evidence-based Management Plan. . 2018 doi: 10.29328/journal.jcn.1001018; 2: 044-052
-
Time within therapeutic range: A comparison of three tacrolimus formulations in renal transplant recipientsKaren Khalil*,Patricia West-Thielke,Alicia B Lichvar,Enrico Benedetti,Henry Okoroike,Shree Patel. Time within therapeutic range: A comparison of three tacrolimus formulations in renal transplant recipients. . 2022 doi: 10.29328/journal.jcn.1001085; 6: 019-025
Recently Viewed
-
Impact of Latex Sensitization on Asthma and Rhinitis Progression: A Study at Abidjan-Cocody University Hospital - Côte d’Ivoire (Progression of Asthma and Rhinitis related to Latex Sensitization)Dasse Sery Romuald*, KL Siransy, N Koffi, RO Yeboah, EK Nguessan, HA Adou, VP Goran-Kouacou, AU Assi, JY Seri, S Moussa, D Oura, CL Memel, H Koya, E Atoukoula. Impact of Latex Sensitization on Asthma and Rhinitis Progression: A Study at Abidjan-Cocody University Hospital - Côte d’Ivoire (Progression of Asthma and Rhinitis related to Latex Sensitization). Arch Asthma Allergy Immunol. 2024: doi: 10.29328/journal.aaai.1001035; 8: 007-012
-
Olfactory Dysfunction in Sports Players following Moderate and Severe Head Injury: A Possible Cut-off from Normality to PathologyGesualdo M Zucco*,Andrea Carletti,Richard J Stevenson. Olfactory Dysfunction in Sports Players following Moderate and Severe Head Injury: A Possible Cut-off from Normality to Pathology. J Sports Med Ther. 2016: doi: 10.29328/journal.jsmt.1001001; 1: 001-005
-
Emerging Trends in Sports Cardiology: The Role of Micronutrients in Cardiovascular Health and PerformanceBiswajit Sharma, Kishore Mukhopadhyay*. Emerging Trends in Sports Cardiology: The Role of Micronutrients in Cardiovascular Health and Performance. J Sports Med Ther. 2024: doi: 10.29328/journal.jsmt.1001086; 9: 073-082
-
Transforming Cancer Care through Physical Exercise: A Path to Holistic HealingJorma Sormunen*. Transforming Cancer Care through Physical Exercise: A Path to Holistic Healing. J Sports Med Ther. 2024: doi: 10.29328/journal.jsmt.1001088; 9: 089-090
-
Hypochlorous acid has emerged as a potential alternative to conventional antibiotics due to its broad-spectrum antimicrobial activityMaher M Akl*. Hypochlorous acid has emerged as a potential alternative to conventional antibiotics due to its broad-spectrum antimicrobial activity. Int J Clin Microbiol Biochem Technol. 2023: doi: 10.29328/journal.ijcmbt.1001026; 6: 001-004
Most Viewed
-
Evaluation of Biostimulants Based on Recovered Protein Hydrolysates from Animal By-products as Plant Growth EnhancersH Pérez-Aguilar*, M Lacruz-Asaro, F Arán-Ais. Evaluation of Biostimulants Based on Recovered Protein Hydrolysates from Animal By-products as Plant Growth Enhancers. J Plant Sci Phytopathol. 2023 doi: 10.29328/journal.jpsp.1001104; 7: 042-047
-
Sinonasal Myxoma Extending into the Orbit in a 4-Year Old: A Case PresentationJulian A Purrinos*, Ramzi Younis. Sinonasal Myxoma Extending into the Orbit in a 4-Year Old: A Case Presentation. Arch Case Rep. 2024 doi: 10.29328/journal.acr.1001099; 8: 075-077
-
Feasibility study of magnetic sensing for detecting single-neuron action potentialsDenis Tonini,Kai Wu,Renata Saha,Jian-Ping Wang*. Feasibility study of magnetic sensing for detecting single-neuron action potentials. Ann Biomed Sci Eng. 2022 doi: 10.29328/journal.abse.1001018; 6: 019-029
-
Pediatric Dysgerminoma: Unveiling a Rare Ovarian TumorFaten Limaiem*, Khalil Saffar, Ahmed Halouani. Pediatric Dysgerminoma: Unveiling a Rare Ovarian Tumor. Arch Case Rep. 2024 doi: 10.29328/journal.acr.1001087; 8: 010-013
-
Physical activity can change the physiological and psychological circumstances during COVID-19 pandemic: A narrative reviewKhashayar Maroufi*. Physical activity can change the physiological and psychological circumstances during COVID-19 pandemic: A narrative review. J Sports Med Ther. 2021 doi: 10.29328/journal.jsmt.1001051; 6: 001-007

HSPI: We're glad you're here. Please click "create a new Query" if you are a new visitor to our website and need further information from us.
If you are already a member of our network and need to keep track of any developments regarding a question you have already submitted, click "take me to my Query."


