Figure 2
Collecting duct PGE2 responses reduce water loss with empagliflozin in mice with type 2 diabetes mellitus
R Nasrallah, J Zimpelmann, V Cheff, JF Thibodeau, KD Burns and RL Hébert*
Published: 08 April, 2021 | Volume 5 - Issue 1 | Pages: 023-030
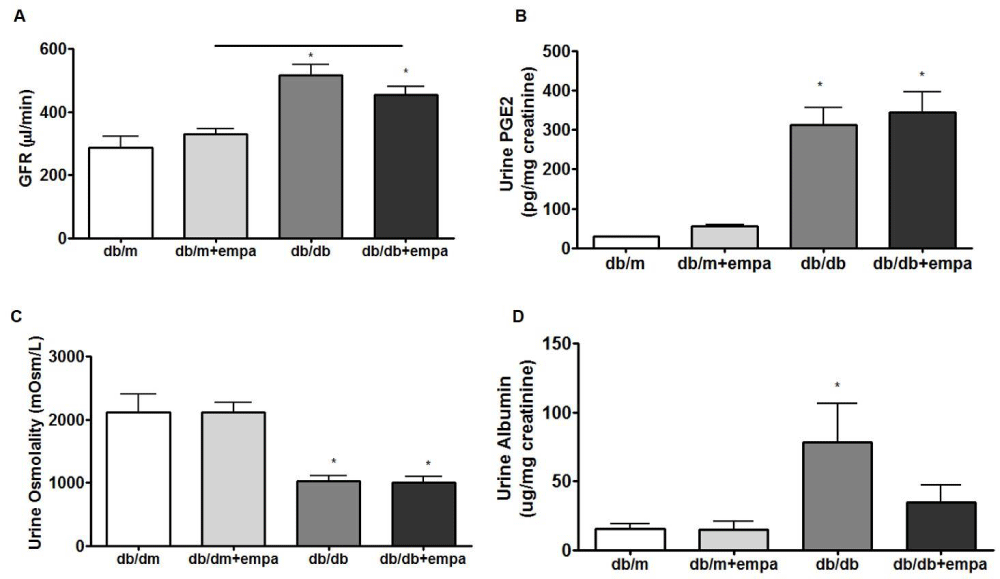
Figure 2:
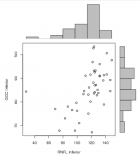
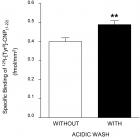
Kidney function and urine analysis. FITC inulin clearance (A), urine PGE2 (B), urine osmolality (C), and urinary albumin levels (D) were assessed in 4 mouse groups: control (db/m), db/m+EMPA, diabetic (db/db), and db/db+EMPA. Data is presented as mean +/- SEM, n = 7-12. *p < 0.05 vs. db/m p < 0.05, and black line indicates significance between two groups.
Read Full Article HTML DOI: 10.29328/journal.jcn.1001069 Cite this Article Read Full Article PDF
More Images
Similar Articles
-
Collecting duct PGE2 responses reduce water loss with empagliflozin in mice with type 2 diabetes mellitusR Nasrallah,J Zimpelmann,V Cheff,JF Thibodeau,KD Burns,RL Hébert*. Collecting duct PGE2 responses reduce water loss with empagliflozin in mice with type 2 diabetes mellitus. . 2021 doi: 10.29328/journal.jcn.1001069; 5: 023-030
Recently Viewed
-
Various Theories of Fast and Ultrafast Magnetization DynamicsManfred Fähnle*. Various Theories of Fast and Ultrafast Magnetization Dynamics. Int J Phys Res Appl. 2024: doi: 10.29328/journal.ijpra.1001101; 7: 154-158
-
Nitrogen Fixation and Yield of Common Bean Varieties in Response to Shade and Inoculation of Common BeanSelamawit Assegid*,Girma Abera. Nitrogen Fixation and Yield of Common Bean Varieties in Response to Shade and Inoculation of Common Bean. J Plant Sci Phytopathol. 2023: doi: 10.29328/journal.jpsp.1001122; 7: 157-162
-
Peripheral perfusion index in critically ill COVID-19 and its association with multiorgan dysfunctionCornu Matias German*, Tonelier Matias, Roel Pedro, Sanhueza Laura, Orozco Sergio Martin, Sepulveda Mariana Elizabet, Svampa Silvana Enrica, Arana Osorio Erick and Martinuzzi Andres Luciano Nicolas. Peripheral perfusion index in critically ill COVID-19 and its association with multiorgan dysfunction. J Clin Intensive Care Med. 2023: doi: 10.29328/journal.jcicm.1001043; 8: 004-013
-
Dalbavancin and moleculight in the COVID-19 pandemicWayne J Caputo*, George Fahoury, Donald Beggs, Patricia Monterosa. Dalbavancin and moleculight in the COVID-19 pandemic. J Clin Intensive Care Med. 2023: doi: 10.29328/journal.jcicm.1001042; 8: 001-003
-
Development of Latent Fingerprints Using Food Coloring AgentsKallu Venkatesh,Atul Kumar Dubey,Bhawna Sharma. Development of Latent Fingerprints Using Food Coloring Agents. J Forensic Sci Res. 2024: doi: 10.29328/journal.jfsr.1001070; 8: 104-107
Most Viewed
-
Evaluation of Biostimulants Based on Recovered Protein Hydrolysates from Animal By-products as Plant Growth EnhancersH Pérez-Aguilar*, M Lacruz-Asaro, F Arán-Ais. Evaluation of Biostimulants Based on Recovered Protein Hydrolysates from Animal By-products as Plant Growth Enhancers. J Plant Sci Phytopathol. 2023 doi: 10.29328/journal.jpsp.1001104; 7: 042-047
-
Sinonasal Myxoma Extending into the Orbit in a 4-Year Old: A Case PresentationJulian A Purrinos*, Ramzi Younis. Sinonasal Myxoma Extending into the Orbit in a 4-Year Old: A Case Presentation. Arch Case Rep. 2024 doi: 10.29328/journal.acr.1001099; 8: 075-077
-
Feasibility study of magnetic sensing for detecting single-neuron action potentialsDenis Tonini,Kai Wu,Renata Saha,Jian-Ping Wang*. Feasibility study of magnetic sensing for detecting single-neuron action potentials. Ann Biomed Sci Eng. 2022 doi: 10.29328/journal.abse.1001018; 6: 019-029
-
Pediatric Dysgerminoma: Unveiling a Rare Ovarian TumorFaten Limaiem*, Khalil Saffar, Ahmed Halouani. Pediatric Dysgerminoma: Unveiling a Rare Ovarian Tumor. Arch Case Rep. 2024 doi: 10.29328/journal.acr.1001087; 8: 010-013
-
Physical activity can change the physiological and psychological circumstances during COVID-19 pandemic: A narrative reviewKhashayar Maroufi*. Physical activity can change the physiological and psychological circumstances during COVID-19 pandemic: A narrative review. J Sports Med Ther. 2021 doi: 10.29328/journal.jsmt.1001051; 6: 001-007

HSPI: We're glad you're here. Please click "create a new Query" if you are a new visitor to our website and need further information from us.
If you are already a member of our network and need to keep track of any developments regarding a question you have already submitted, click "take me to my Query."


